Death data from the Washington State Department of Health Center for Health Statistics are combined with population data from the Office of Financial Management to create rates of deaths per 100,000 residents. Data include only deaths for which the underlying cause of death was determined to be drug poisoning. For more information on data, see details at the end of the page. 2025 death data are preliminary and counts will likely increase.

Maps by primary opioid category will appear below when you select a type of map.
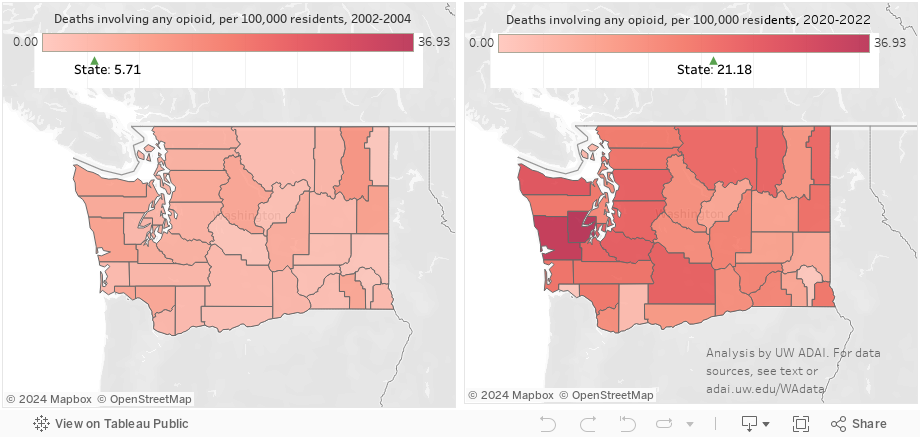
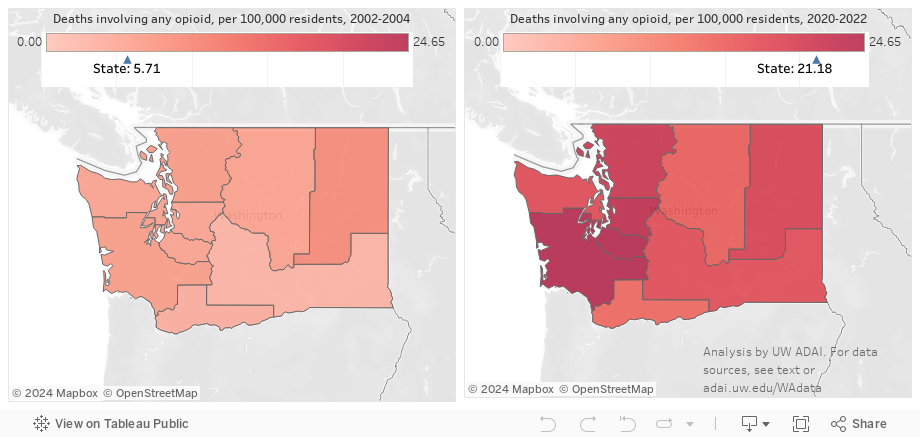
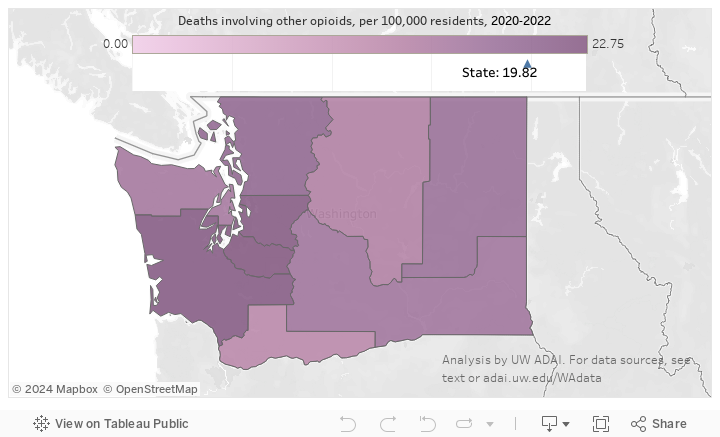
See death rates by county See death rates by Accountable Community of HealthAs a whole, opioid deaths regardless of subtype occur throughout the state. Almost all counties saw increasing opioid death rates between 2002-2004 and 2024-2025, whether urban or rural, west or east of the Cascades. The more populous counties on each side of the mountains, King, Pierce, and Snohomish in the west and Spokane and Yakima in the east, all had opioid death rates increase by over 275%. Some smaller counties had increases of five-fold or more. The statewide rate has accelerated in recent years before 2024. As we show near the end of the page, this increase is being driven by the other synthetic opioids category, which includes the fentanyls.
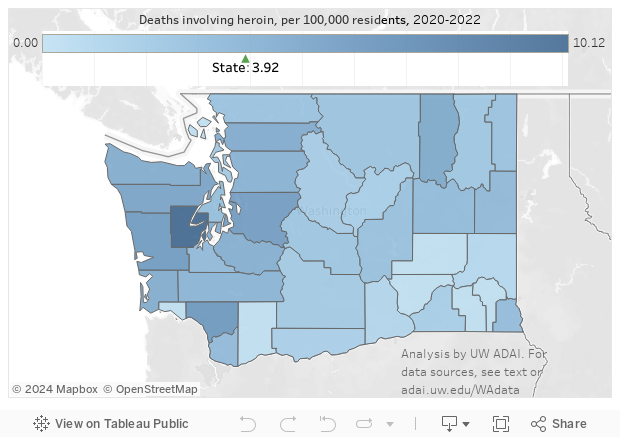
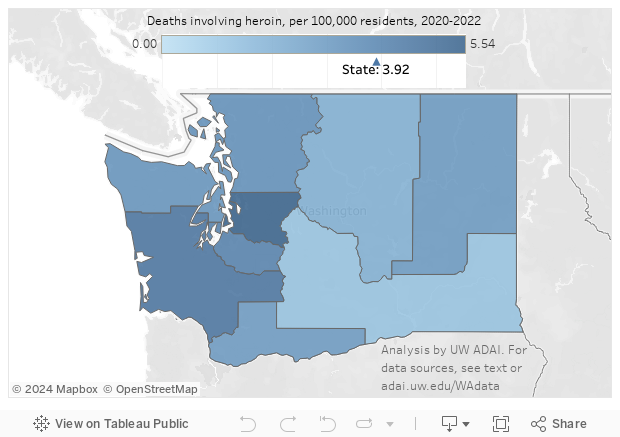
Heroin is far less prominent than in decades past and, at least in crime lab data, not confined to the western part of the state, or to more populous areas. We do not show rates for the earlier period (2002-04) for heroin or other opioid (non-heroin) deaths because of the likely misclassification we discuss further below, which varied by county. To summarize, in the earlier period, some counties were much better than others at identifying true heroin deaths, and thus changes over time are likely to be amplified simply by better classification.
Deaths attributed to prescription-type and other opioids had been on the decline. As this subtype includes fentanyl, this category has increased since 2019. See below for a further breakout of this category.
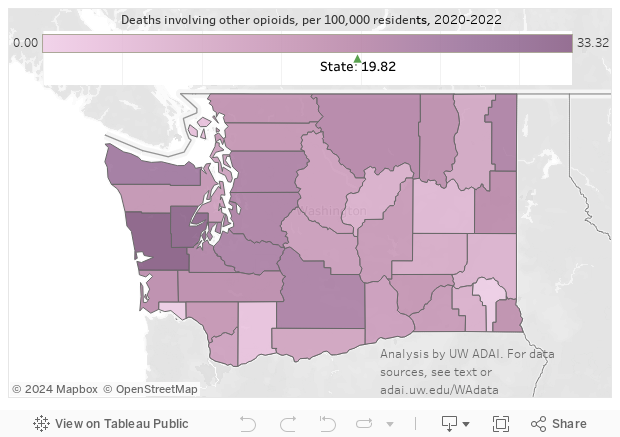
In the figure above, we simply report rates per 100,000 residents of drug poisonings attributed to opioids, cocaine or methamphetamine. These rates are not mutually exclusive, and many deaths involve more than one of these 3 major types of drugs.
In the figure below, we again show death rates, but break out deaths involving methamphetamine (M), cocaine (C), and opioids (O) alone or in combination. To focus on the relationship among these three drugs we ignore the (frequent) presence of any other drug, most prominently alcohol or benzodiazepines. Thus, opioid deaths are broken out as opioids only (no C or M), opioids and cocaine (no M), methamphetamine and opioids (no C), and all three (methamphetamine, opioids, and cocaine), each with or without other substances. For each type of drug poisoning, we present the results in a stacked chart to show how they contribute to the overall rate of drug poisonings.
Alcohol, barbiturates, or benzodiazepines, which all act as central nervous system depressants, are commonly involved with other drugs in drug poisonings, particularly with opioids. If you click on the 'Opioid deaths detail' button, the chart switches to subtypes of drug poisonings involving opioids. Those not involving cocaine or methamphetamine are further divided into those that did and those that did not also involve alcohol, barbiturates, and/or benzodiazepines (ABB).
In order to compare to national trends from the CDC, we compare opioid-involved drug poisonings involving heroin, commonly prescribed opioids, and other synthetic opioids, some of which are illegal. Press the "Death rates" button to see rates per 100,000 residents, and the "Percent of opioid deaths" to see what percentage of all these deaths involved each of the three main subtypes. Specification of opioids into specific subtypes in death certificate data has improved over the years. Thus, part of the increase in the share of opioid deaths involving heroin after 2010 was due to better documentation of heroin by medical examiners (see details at the end of the page). We do know that part of the decline in the rate of other-opioid-involved deaths as heroin death rates increased was due to a switch to heroin among those with opioid use disorders (for example, a survey of heroin users in King County found that 39% reported being "hooked on" prescription-type opioids first). More recently, the other synthetic opioids category, mostly fentanyls, has become the main driver of increased drug poisoning deaths. Recall that many opioid deaths involve multiple opioids, and so these rates and percentages are not mutually exclusive.
In the Death rates chart, we also allow comparison with two aggregates of pharmaceutical opioids legitimately distributed up to the retail level obtained from the US Drug Enforcement Administration. The "all Rx opioids" series includes methadone and buprenorphine, now most commonly used to treat opioid use disorder, while the "common opioid pain Rx" series does not. Both of the measures of legal opioid supply are expressed as daily doses per person in Washington for the whole year. See our ARCOS analysis page for more information. Click on either series to add it to the chart and compare it to commonly prescribed opioid deaths.
2025 death data are preliminary. While proportions involving a given drug may change little, counts may increase slightly once finalized.
Drug-caused deaths are based on individual-level death certificate data from the state Department of Health. We restrict analysis to drug poisonings (based on ICD-10 codes X40-X44, X60-X64, X85, and Y10-Y14 as the underlying cause of death) involving Washington residents who died in Washington. This common definition excludes cases where alcohol poisoning or alcoholism, carbon monoxide poisoning, etc., was coded as the underlying cause of death. Deaths involving any opioid are based on contributing cause of death coding (ICD codes T40.0-T40.4 or T40.6; T40.5 signifies cocaine). As of this writing, finalized death data are available through 2024. (However, the state's review and confirmation of potential opioid cases, conducted from 1999 through 2015, has been eliminated from defining opioid deaths. The opioid-involved deaths listed here may be an undercount as they miss cases caught previously in this review.) Many drug deaths involve multiple drugs, and identifying the single drug out of many that resulted in death is impossible. Thus, these deaths are best described as drug poisonings involving the drug or category of drugs specified.
Identification of heroin (T40.1) as a contributing cause of death is difficult and has improved over time, due in part to the state Department of Health working with local coroners and medical examiners to improve testing and reporting. This paper describes some of the difficulties (see sidebar).
Following the lead of the CDC, among other opioids (anything besides heroin) we specify deaths involving commonly prescribed opioids--combining methadone (T40.3) with other natural and semisynthetic opioids (T40.2)--and other synthetic opioids (T40.4), most prominent among them being fentanyl and fentanyl analogues.
Identification of methamphetamine deaths is based on searching written information saved in the electronic death certificates for relevant words containing "meth" and/or "thamphet", including innumerable misspellings of methamphetamine. This written information ("literals") is available back to 2003.
To smooth out the effects of small counties and to correspond to the Department of Health's management of some public health programming through grouping counties into Accountable Communities of Health, we present death rates by ACH as well as by county. We use a shorter time period for "recent" (2024-2025) than the past comparison period. The larger "past" period provides more deaths, stabilizing proportions, while the shorter "current" period--which still has more drug poisonings--gives a better picture of current circumstances.