Data are presented on cocaine deaths alone and in combination with methamphetamine and opioids (all with or without other drug classes or alcohol), and state crime lab cases positive for cocaine, for Washington state and for counties. Data are from state agencies, analyzed by staff at ADAI. For more information on data, see details at the end of the page.
Many of the charts on this page are interactive. Move the pointer over or click on a data point to see the count or rate, or on an item in the legend to highlight that data series. This does not apply to downloaded charts.
In the table below, demographic descriptors of drug poisonings involving cocaine are presented, and the subset of those deaths that also involved opioids. The ethnic group descriptors White, Black, Native American (American Indian or Alaska Native), Asian, (Native Hawaiian or other) Pacific Islander, and Multiple races are mutually exclusive categories designated by the state to align with the US Census to indicate the race of the deceased. This coding is available beginning 2004. Hispanic is from a different variable in the death certificate files and is not mutually exclusive with the other races listed. Race and ethnicity are based on what is reported on the death certificate by the certifier, usually the coroner or medical examiner's office, and may not align with the person's identity.
Compared to drug-caused overdoses overall, those involving cocaine are more often male. Deaths are disproportionately African American throughout the entire period, although this share appears to have decreased since its 2023 peak. Cocaine deaths as a whole peaked in 2023, driven by nearly 82% also having an opioid listed. In the past two years well over 75% of cocaine deaths involved an opioid.
| Year | Deaths | Median age | Female | White | Black | Native American | Asian | Pacific Islander | Multiple races | Hispanic | Number with opioids | Percent with opioids | Rate per 100,000 state residents |
|---|---|---|---|---|---|---|---|---|---|---|---|---|---|
| 2003 | 159 | 43 | 30.2% | 6.3% | 99 | 62.3% | 2.60 | ||||||
| 2004 | 179 | 45 | 30.2% | 78.2% | 15.1% | 5.0% | 0 | 0 | 1.7% | 6.1% | 112 | 62.6% | 2.88 |
| 2005 | 166 | 44 | 22.9% | 71.1% | 15.7% | 9.0% | 0.6% | 0 | 3.0% | 5.4% | 96 | 57.8% | 2.64 |
| 2006 | 218 | 44 | 25.2% | 74.3% | 18.8% | 2.3% | 1.4% | 0 | 3.2% | 5.0% | 129 | 59.2% | 3.40 |
| 2007 | 166 | 44.5 | 30.1% | 70.5% | 22.3% | 5.4% | 0.6% | 1.2% | 0 | 4.8% | 100 | 60.2% | 2.54 |
| 2008 | 127 | 47 | 33.9% | 75.6% | 15.7% | 4.7% | 0.8% | 0.8% | 2.4% | 3.1% | 77 | 60.6% | 1.92 |
| 2009 | 118 | 45 | 32.2% | 73.7% | 14.4% | 4.2% | 3.4% | 0 | 4.2% | 6.8% | 72 | 61.0% | 1.77 |
| 2010 | 76 | 46.5 | 28.9% | 68.4% | 22.4% | 3.9% | 2.6% | 0 | 1.3% | 3.9% | 45 | 59.2% | 1.13 |
| 2011 | 96 | 49 | 33.3% | 68.8% | 17.7% | 9.4% | 1.0% | 0 | 3.1% | 2.1% | 58 | 60.4% | 1.42 |
| 2012 | 65 | 48 | 36.9% | 76.9% | 12.3% | 4.6% | 1.5% | 0 | 4.6% | 12.3% | 34 | 52.3% | 0.95 |
| 2013 | 92 | 48 | 25.0% | 66.3% | 23.9% | 2.2% | 4.3% | 0 | 3.3% | 8.7% | 48 | 52.2% | 1.34 |
| 2014 | 88 | 51 | 27.3% | 70.5% | 23.9% | 0 | 2.3% | 0 | 3.4% | 3.4% | 66 | 75.0% | 1.26 |
| 2015 | 89 | 47 | 29.2% | 66.3% | 22.5% | 4.5% | 2.2% | 0 | 4.5% | 4.5% | 51 | 57.3% | 1.26 |
| 2016 | 86 | 46 | 22.1% | 64.0% | 23.3% | 5.8% | 1.2% | 1.2% | 0 | 8.1% | 48 | 55.8% | 1.20 |
| 2017 | 119 | 43 | 26.1% | 68.1% | 17.6% | 4.2% | 5.9% | 0.8% | 0.8% | 8.4% | 70 | 58.8% | 1.63 |
| 2018 | 137 | 47 | 31.4% | 70.1% | 24.1% | 2.2% | 2.2% | 1.5% | 0 | 8.8% | 82 | 59.9% | 1.84 |
| 2019 | 137 | 40 | 24.8% | 65.7% | 20.4% | 2.9% | 3.6% | 0.7% | 5.8% | 10.9% | 100 | 73.0% | 1.82 |
| 2020 | 197 | 44 | 22.8% | 61.4% | 23.9% | 2.5% | 3.6% | 1.0% | 7.1% | 9.6% | 140 | 71.1% | 2.56 |
| 2021 | 243 | 44 | 27.6% | 62.1% | 24.7% | 3.7% | 2.1% | 1.2% | 5.3% | 8.6% | 176 | 72.4% | 3.13 |
| 2022 | 370 | 48.5 | 26.8% | 59.2% | 25.9% | 2.4% | 4.3% | 0.3% | 6.5% | 11.9% | 284 | 76.8% | 4.70 |
| 2023 | 607 | 52 | 25.7% | 59.5% | 28.7% | 2.8% | 4.6% | 0.2% | 3.3% | 10.5% | 497 | 81.9% | 7.63 |
| 2024 | 486 | 51 | 25.3% | 61.9% | 25.1% | 3.3% | 3.3% | 0.6% | 5.3% | 11.3% | 375 | 77.2% | 6.05 |
| 2025 | 492 | 50 | 20.7% | 62.6% | 22.4% | 3.7% | 3.5% | 0.4% | 7.1% | 11.8% | 386 | 78.5% | 6.06 |
The figure below, when 'All drug poisonings' is selected, shows deaths involving cocaine (C), methamphetamine (M), and opioids (O) alone or in combination (ignoring all other substances). For each type of drug poisoning, the results are presented in a stacked chart to show how they contribute to the overall rate of drug poisonings.
If the 'Cocaine deaths detail' button is clicked, the chart switches to show (selected) subtypes of drug poisonings involving cocaine. Among those without methamphetamine or opioids, the chart details deaths with and without alcohol, barbiturates, or benzopiazepines (ABB), which all act as central nervous system depressants and are commonly involved with other drugs in drug poisonings.
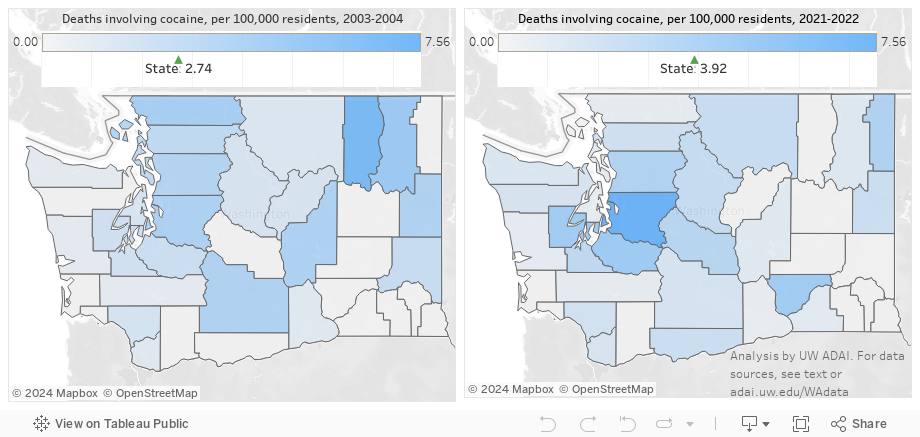
After declines for much of the first two decades of the millenium, the map below shows the distribution of increases in cocaine-involved drug poisonings compared to 2003-2004. In that earlier period when cocaine deaths were more common than deaths involving methamphetamine, 14 of Washington's 39 counties had a cocaine-involved drug poisoning rate above 2.0 per 100,000 residents. In 2024-2025, 23 counties exceeded 2.0 deaths per 100,000. A number of rural counties, most notably Mason, Jefferson, and Okanogan, have seen large increases in drug deaths involving cocaine.
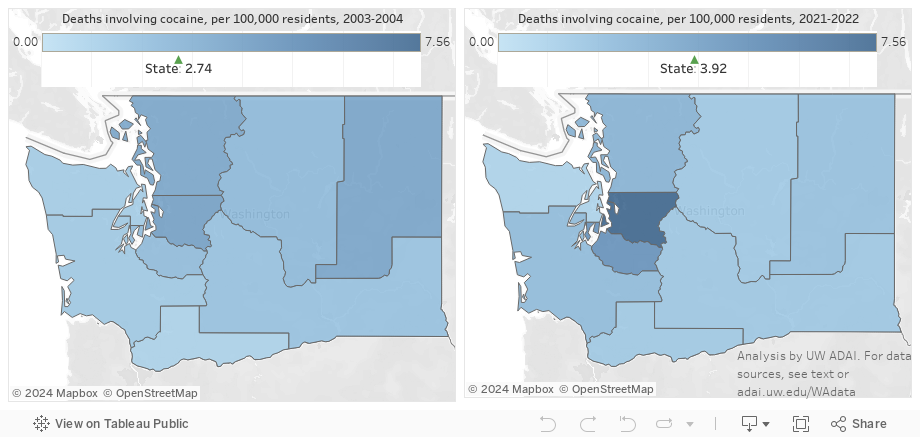
To smooth out the effects of small numbers and to correspond to the Department of Health's management of some public health programming through grouping counties into Accountable Communities of Health, we present death rates by ACH.
Police evidence testing positive for cocaine at the crime lab peaked in 2005 and remained elevated until 2008. It is believed that part of this decline is a change in police evidence gathering procedures resulting from a 2008 US Supreme Court case. Low levels of cocaine before 2021 appear to have been due to declines in cocaine availability broadly in the US. The overall numbers of cocaine evidence testing are historically relatively low in statewide data as much of the cocaine availability and use is in the Puget Sound area. (You can click on more common series, such as methamphetamine, to turn them off and better see the cocaine trends.)
Cocaine deaths now exceed their prior peak of the mid 2000s, mostly, as shown above, due to the involvement of opioids, most often fentanyl. There remain deaths involving cocaine and no other major drug, although their share is declining. Here we explore some of the characteristics of cocaine overdose deaths over time by whether they involved other substances or not, simplifying the above graph to look at cocaine-involved deaths involving methamphetamine (M), opioids (O), and/or alcohol, barbiturates, or benzodiazepines (ABB).
The median age at death among drug deaths involving cocaine without MOABB has largely increased since 1999. The median age for deaths involving cocaine with MOABB decreased in the mid 2010s, a time characterized by heroin replacing prescription opioids, and then increased as fentanyls took over the opioids market. We next pool the past two years of poisonings to compare all available demographic information between the two groups. The ethnic group descriptors White, Black, Native American (American Indian or Alaska Native), Asian, (Native Hawaiian or other) Pacific Islander, and Multiple races are mutually exclusive categories designated by the state to align with the US Census to indicate the race of the deceased. Hispanic is from a different variable in the death certificate files and is not mutually exclusive with the other races listed. Race and ethnicity are based on what is reported on the death certificate by the certifier, usually the coroner or medical examiner's office, and may not align with the person's identity.
While the age gap appears to be declining, over the last two years it does amount to the cocaine alone group being 12% older at death than the cocaine and MOABB group. In addition to being older, decedents in the cocaine alone group are 20% more likely to be black, 39% more likeliy to be Asian, five times more likely to be listed as Pacific Islander, 32% less likely to be Hispanic, and one-seventh as likely to be listed as multiple races.
2025 death data are preliminary, and counts will change. Shares--the percentage of cocaine deaths in a given category--are unlikely to change appreciably, unless the category of interest systematically takes more time to investigate and finalize.
Drug-caused deaths are based on individual-level death certificate data from the state Department of Health. Analyses are limited to drug poisonings (based on ICD-10 codes X40-X44, X60-X64, X85, and Y10-Y14 as the underlying cause of death) involving Washington residents who died in Washington. This common definition excludes cases where alcohol poisoning or alcoholism, carbon monoxide poisoning, etc., was coded as the underlying cause of death. Identification of methamphetamine deaths is based on searching written information saved in the electronic death certificates for relevant words containing "meth" and/or "thamphet". This written information ("literals") is available back to 2003. Deaths involving any opioid are based on contributing cause of death coding (ICD codes T40.0-T40.4 or T40.6). Code T40.5 in the cause of death coding signifies cocaine. As of this writing, finalized death data are available through 2024. (However, the state's review and confirmation process for potential opioid cases, conducted from 1999 through 2015, has been eliminated from defining opioid deaths. The opioid-involved deaths listed here are almost always an undercount as they miss cases caught previously in this review.) Many drug deaths involve multiple drugs, and medical examiners and coroners in Washington state do not attempt to identify the single drug out of many that caused the death. Thus, these deaths are best described as drug poisonings involving the type of drug specified.
Crime lab cases reflect drugs seized by state and local law enforcement and by federal and other multi-county agencies throughout the state and sent to a branch of the state crime lab for testing as potential evidence. A given case may have one or several pieces of evidence positive different drugs.
Data on this page are presented as counts or (crude) rates, estimated as per 100,000 residents in the state or county.