We present information on methamphetamine deaths and state crime lab cases for Washington state and for counties. Data are from state agencies originally, but the analysis is our own. For more information on data, see details at the end of the page.
Many of the charts on this page are interactive. You can move your pointer over or click on a data point to see the count or rate, or on an item in the legend to highlight that data series. This does not apply to downloaded charts.
We examine the contribution of methamphetamine to drug poisoning deaths in Washington. This contribution has increased in recent years, often due to combining methamphetamine with other drugs.
In the table below, we examine demographic descriptors of drug poisonings involving methamphetamine, and the subset of those deaths that also involved opioids. The ethnic group descriptors White, Black, Native American (American Indian or Alaska Native), Asian, (Native Hawaiian or other) Pacific Islander, and Multiple races are mutually exclusive categories designated by the state to align with the US Census to indicate the race of the deceased. This coding is available beginning 2004. Hispanic is from a different variable in the death certificate files and is not mutually exclusive with the other races listed. Race and ethnicity are based on what is reported on the death certificate by the certifier, usually the coroner or medical examiner's office, and may not align with the person's identity.
| Year | Deaths | Median age | Female | White | Black | Native American | Asian | Pacific Islander | Multiple races | Hispanic | Number with opioids | Percent with opioids | Rate per 100,000 state residents |
|---|---|---|---|---|---|---|---|---|---|---|---|---|---|
| 2003 | 89 | 40 | 25.8% | 0.0% | 32 | 36.0% | 1.45 | ||||||
| 2004 | 98 | 39.5 | 28.6% | 87.8% | 2.0% | 4.1% | 2.0% | 0 | 4.1% | 3.1% | 40 | 40.8% | 1.58 |
| 2005 | 102 | 43 | 21.6% | 89.2% | 2.9% | 5.9% | 0 | 0 | 2.0% | 2.9% | 44 | 43.1% | 1.62 |
| 2006 | 93 | 44 | 25.8% | 86.0% | 2.2% | 6.5% | 1.1% | 1.1% | 3.2% | 3.2% | 45 | 48.4% | 1.45 |
| 2007 | 98 | 43 | 33.7% | 89.8% | 3.1% | 4.1% | 2.0% | 0 | 1.0% | 3.1% | 35 | 35.7% | 1.50 |
| 2008 | 83 | 44 | 34.9% | 89.2% | 1.2% | 2.4% | 3.6% | 1.2% | 2.4% | 3.6% | 25 | 30.1% | 1.26 |
| 2009 | 120 | 46 | 27.5% | 90.0% | 1.7% | 5.0% | 1.7% | 0 | 1.7% | 1.7% | 55 | 45.8% | 1.80 |
| 2010 | 120 | 45.5 | 34.2% | 91.7% | 2.5% | 5.0% | 0 | 0.8% | 0 | 5.0% | 38 | 31.7% | 1.78 |
| 2011 | 153 | 44 | 31.4% | 87.6% | 2.6% | 7.2% | 0 | 0.7% | 2.0% | 5.9% | 59 | 38.6% | 2.26 |
| 2012 | 172 | 45 | 26.2% | 90.7% | 2.9% | 4.7% | 1.2% | 0 | 0.6% | 6.4% | 60 | 34.9% | 2.52 |
| 2013 | 237 | 45 | 29.5% | 84.4% | 6.3% | 4.2% | 2.1% | 0.4% | 2.5% | 5.1% | 84 | 35.4% | 3.44 |
| 2014 | 256 | 45 | 31.3% | 83.6% | 3.9% | 7.0% | 1.2% | 0.8% | 3.5% | 3.5% | 120 | 46.9% | 3.67 |
| 2015 | 344 | 44 | 26.5% | 83.3% | 7.6% | 5.2% | 0.3% | 0.6% | 3.2% | 9.0% | 133 | 38.7% | 4.87 |
| 2016 | 365 | 45 | 34.0% | 79.7% | 5.5% | 6.0% | 1.6% | 2.2% | 3.3% | 6.6% | 156 | 42.7% | 5.08 |
| 2017 | 476 | 45 | 28.4% | 80.3% | 4.4% | 7.4% | 2.3% | 1.7% | 2.3% | 7.1% | 204 | 42.9% | 6.51 |
| 2018 | 531 | 47 | 28.2% | 80.6% | 4.7% | 5.6% | 1.9% | 1.5% | 4.9% | 6.4% | 241 | 45.4% | 7.15 |
| 2019 | 638 | 47 | 30.7% | 81.5% | 5.5% | 4.4% | 0.9% | 0.8% | 4.2% | 6.7% | 301 | 47.2% | 8.45 |
| 2020 | 808 | 48 | 30.2% | 80.7% | 5.7% | 4.5% | 1.2% | 0.5% | 6.4% | 5.8% | 421 | 52.1% | 10.48 |
| 2021 | 1239 | 49 | 26.6% | 77.6% | 9.3% | 5.6% | 1.2% | 0.8% | 4.4% | 6.5% | 698 | 56.3% | 15.95 |
| 2022 | 1463 | 49 | 25.4% | 76.4% | 9.2% | 5.2% | 1.5% | 1.0% | 4.9% | 8.0% | 953 | 65.1% | 18.60 |
| 2023 | 2011 | 48 | 25.2% | 75.3% | 10.4% | 4.7% | 1.9% | 1.0% | 4.9% | 8.3% | 1499 | 74.5% | 25.29 |
| 2024 | 1995 | 47 | 27.1% | 76.1% | 9.0% | 6.1% | 1.8% | 0.7% | 5.6% | 9.3% | 1451 | 72.7% | 24.83 |
| 2025 | 1846 | 48 | 26.7% | 75.1% | 8.8% | 6.3% | 1.8% | 1.1% | 5.7% | 10.6% | 1320 | 71.5% | 22.75 |
In the figure below, we again show death rates, but now break out deaths involving methamphetamine (M), cocaine (C), and opioids (O) alone or in combination. We ignore the presence of any other drug, most prominently alcohol or benzodiazepines. Thus, methamphetamine deaths are broken out as methamphetamine only (no C or O), methamphetamine and cocaine (no O), methamphetamine and opioids (no C), and all three (methamphetamine, opioids, and cocaine), each with or without other substances. For each type of drug poisoning, we present the results in a stacked chart to show how they contribute to the overall rate of drug poisonings.
Alcohol, barbiturates, or benzodiazepines, which all act as central nervous system depressants, are commonly involved with other drugs in drug poisonings, particularly with opioids. If you click on the 'Methamphetamine deaths detail' button, the chart switches to subtypes of drug poisonings involving methamphetamine. Those not involving cocaine or opioids are further divided into those that did and those that did not also involve alcohol, barbiturates, and/or benzodiazepines (ABB).
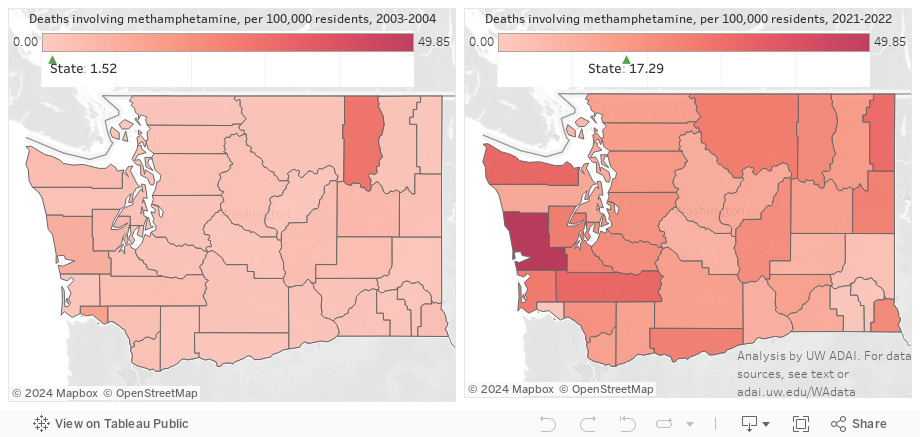
Increases in methamphetamine deaths are particularly notable all over the state. Really only small counties had no change or declines, while most counties saw their rates increase by a factor of five or more. Note that Ferry County had less than 7400 residents, meaning it is an unstable outlier in terms of death rates in the early period.
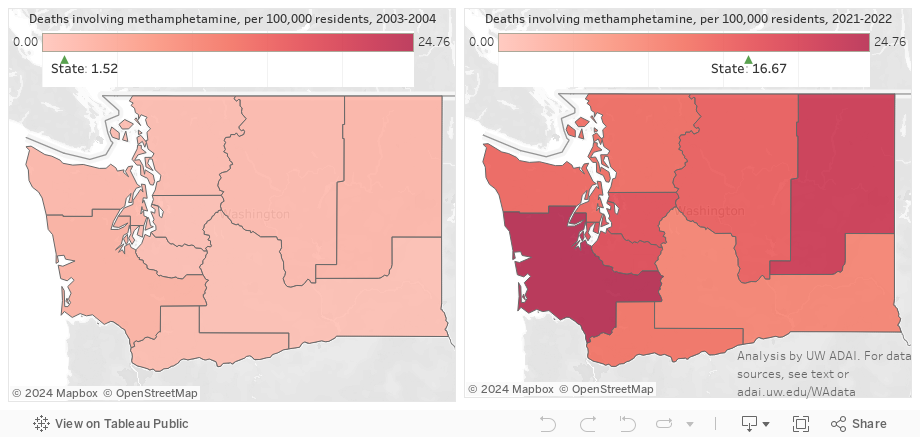
To smooth out the effects of small counties and to correspond to the Department of Health's management of some public health programming through grouping counties into Accountable Communities of Health, we present death rates by ACH.
Methamphetamine-involved deaths have generally increased over time. As shown above, much of this increase has been in deaths with one or more opioid also present, most often fentanyl. But deaths involving methamphetamine and no other major drug have also increased. There is evidence that methamphetamine-involved overdose deaths may be in part due to long-term, cumulative impacts of methamphetamine, so we might expect the proportion dying over time to increase and for that population to get older. Here we explore some of the characteristics of methamphetamine overdose deaths over time by whether they involved other substances or not, simplifying the above graph to look at methamphetamine-involved deaths involving cocaine (C), opioids (O), and/or alcohol, barbiturates, or benzodiazepines (ABB).
Given the increase in median age at death among drug deaths involving methamphetamine without COABB, we next pool the past two years of poisonings to compare all available demographic information between the two groups. The ethnic group descriptors White, Black, Native American (American Indian or Alaska Native), Asian, (Native Hawaiian or other) Pacific Islander, and Multiple races are mutually exclusive categories designated by the state to align with the US Census to indicate the race of the deceased. Hispanic is from a different variable in the death certificate files and is not mutually exclusive with the other races listed. Race and ethnicity are based on what is reported on the death certificate by the certifier, usually the coroner or medical examiner's office, and may not align with the person's identity.
In addition to being older, decedents in the meth alone group are over 41% less likely to be black, 34% less likely to be Native, and 29% less likely to be listed as Hispanic.
2025 death data are preliminary, and counts will change. Shares--the percentage of methamphetamine deaths in a given category--are unlikely to change appreciably, unless the category of interest systematically takes more time to investigate and finalize.
Drug-caused deaths are based on individual-level death certificate data from the state Department of Health. We restrict analysis to drug poisonings (based on ICD-10 codes X40-X44, X60-X64, X85, and Y10-Y14 as the underlying cause of death) involving Washington residents who died in Washington. This common definition excludes cases where alcohol poisoning or alcoholism, carbon monoxide poisoning, etc., was coded as the underlying cause of death. Identification of methamphetamine deaths is based on searching written information saved in the electronic death certificates for relevant words containing "meth" and/or "thamphet". This written information ("literals") is available back to 2003. Deaths involving any opioid are based on contributing cause of death coding (ICD codes T40.0-T40.4 or T40.6; T40.5 signifies cocaine). As of this writing, finalized death data are available through 2024. (However, the state's review and confirmation of potential opioid cases, conducted from 1999 through 2015, has been eliminated from defining opioid deaths. The opioid-involved deaths listed here are almost always an undercount as they miss cases caught previously in this review.) Many drug deaths involve multiple drugs, and identifying the single drug out of many that resulted in death is impossible. Thus, these deaths are best described as drug poisonings involving the type of drug specified.
On this page, to define "meth alone" versus "meth with other drugs", we consider only any opioid, cocaine, and alcohol, barbiturates, or benzodiazepines as "other drugs" present. (Note that alcohol may not be the underlying cause of death for the death to be considered a drug poisoning, but may be listed as contributing.) This delineation ignores the presence of, for example, antidepressants.
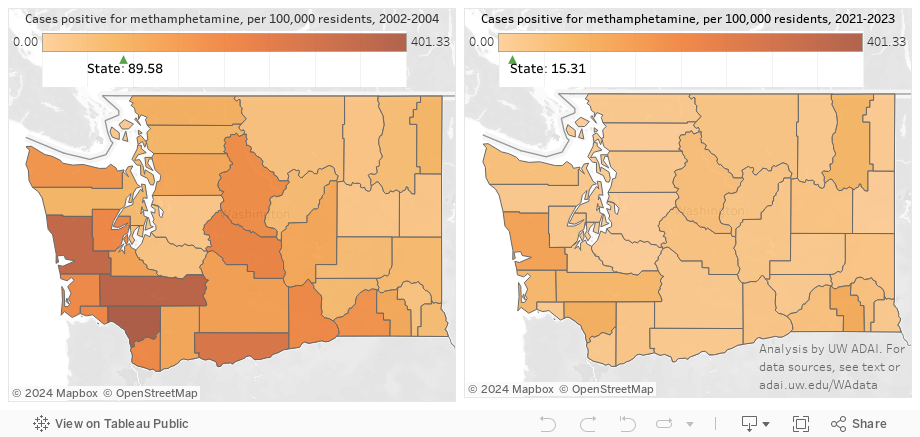
Crime lab cases reflect drugs seized by state and local law enforcement and by federal and other multi-county agencies throughout the state and sent to a branch of the state crime lab for testing as potential evidence. A given case may have one or several positive drug results.
Data on this page are presented as counts or (crude) rates, estimated as per 100,000 residents in the county or state. Note that Washington has several counties with small populations, which may make rates unstable: A small change in the numerator (an increase in the count of 3 or a decrease of 2, for example, in a population of 5000) could result in a relatively large change in the rate. Garfield, Wahkiakum, Columbia, and Ferry Counties each have well under 10,000 residents. For the early versus more recent comparison in the map, we use a 3-year pre period to stabilize the comparison period, and 2 years to give more stability for the recent estimate.